
How Cambridge Real Estate Micro Markets Shape Values
Why does one Cambridge condo fly off the market while a similar one a few blocks away lingers or sells for less? If you have compared Harvard, Central, Kendall, or Porter, you’ve felt the difference. Each pocket has its own buyer pool, housing stock, transit access and development story. In this guide, you’ll learn how those micro-markets influence price, days on market and strategy so you can buy or sell with confidence. Let’s dive in.
A micro-market is a small, distinct area with its own demand drivers, property mix and pricing norms. In Cambridge, the Red Line anchors many of these pockets. Boundaries can feel fuzzy, so define what you mean by the area before you compare sales. A clear definition keeps your comps relevant and your expectations realistic.
Historic streets, older single-family homes and brownstones, and strong pedestrian life shape Harvard’s appeal. Prestige, walkability and limited supply often create a scarcity premium. Owner-occupiers and long-term buyers are common, and new construction is limited near historic corridors.
A major employment center with biotech and tech draws well-paid professionals and investors. You’ll see new luxury condos, lab conversions and high rental demand. Single-family options are fewer, while turnover in condos can be higher due to job mobility and investor activity.
A lively, mixed-use district on the Red Line with restaurants, culture and a wide range of housing. The area offers older multi-family buildings, many condos and some new development. It can offer relative affordability vs. Harvard or Kendall for similar commute times, with a higher share of investment-style properties.
A transit hub with the Red Line and commuter rail access plus neighborhood retail. Housing ranges from single-family homes to multi-family and some student rentals. You’ll find quieter residential blocks and more variability from street to street.
Inman Square, West Cambridge, Cambridgeport and Riverside each has a distinct buyer pool, housing stock and amenity mix. Proximity to campuses, the Charles River and key retail clusters all influence demand.
Local employers shape who is shopping and why. Harvard and MIT influence nearby demand, while Kendall’s companies expand the pool of corporate relocations and investors. Neighborhoods with more owner-occupiers can behave differently than areas popular with investors.
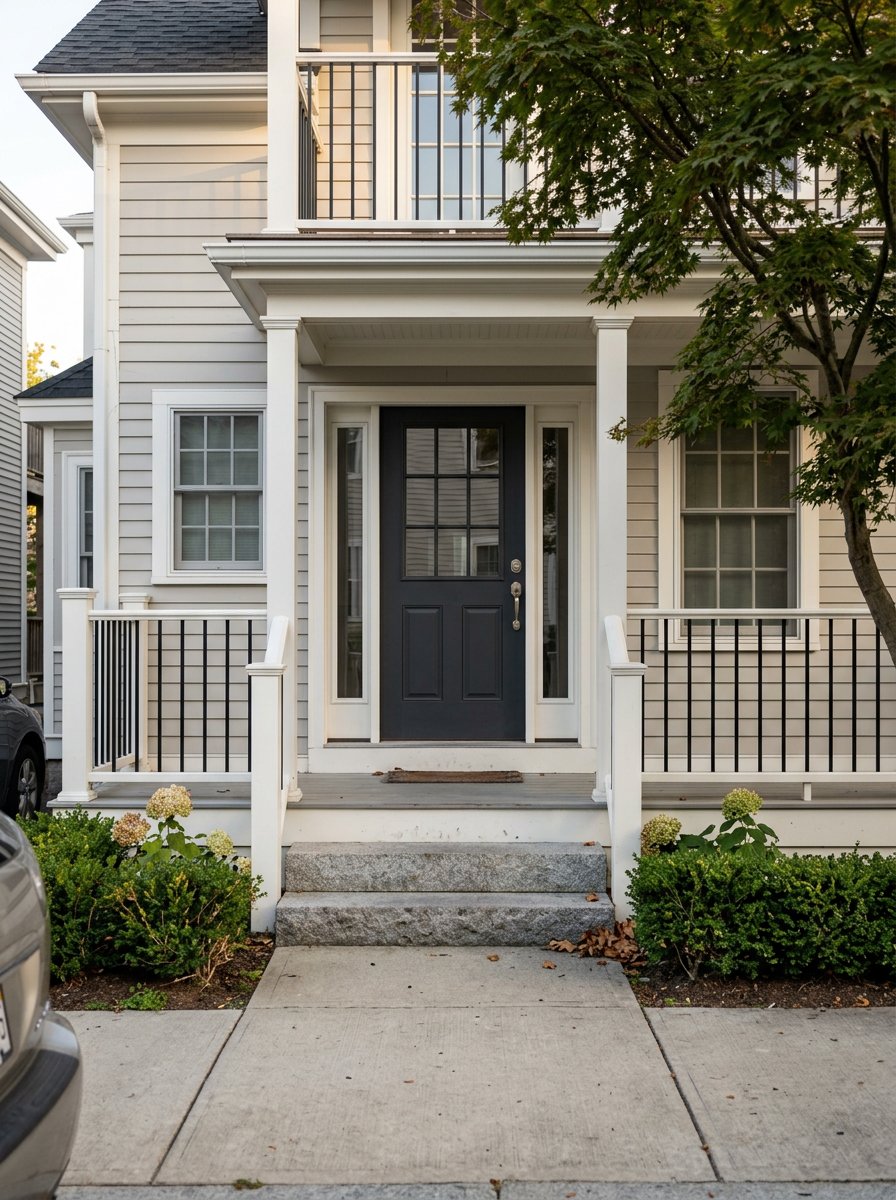
Cambridge includes historic single-family homes, triple-deckers, multi-family buildings and new luxury towers. The same bed and bath count can trade at different prices depending on property type, age, layout, and maintenance history. Multi-family properties often price on income and cap rates, while condos follow comparable sales and fee structures.
Historic districts and tight zoning limit new inventory in places like Harvard Square, which can support higher prices. Areas with new development, such as Kendall, may see pricing adjust as fresh supply comes to market.
A short walk to the Red Line is a measurable premium. Even small distance differences can affect price and days on market. Map the actual walk time to each station when you compare options.
Parks, grocery access, dining and cultural venues matter. Retail clusters in Harvard and the employment base in Kendall often keep demand resilient. Neutral factors like amenities and convenience drive behavior as much as square footage.
If a lot allows additional units or an accessory dwelling, investors may pay more. Future development options influence value, especially for multi-family and mixed-use lots.
Neighborhoods with higher investor ownership can see pricing tied to rent rolls and cap rates. This can lead to different negotiation dynamics than in owner-occupied pockets.
Condition, finishes, deeded parking, outdoor space, floor level, views and condo fees can swing value between similar units. Two “same size” condos may not be truly comparable once you account for these details.
Academic calendars, new development deliveries, company hiring cycles and interest rate moves can shift demand. The timing of your list or offer date may matter more in some neighborhoods than others.
Use a consistent time window. A 12-month rolling view helps smooth out monthly noise, and a 3-year trend shows momentum. Track these at the city and neighborhood level, using the same definitions and filters for each view:
When you analyze, compare like with like. Filter by property type, size range and renovation level. Note whether parking, outdoor space or special views are present. For smaller micro-pockets, sample sizes can be thin, so use medians and note the distribution, not just the headline number.
The Harvard unit may command more due to scarcity, prestige and high walkability, even with similar square footage. Central often has a deeper pool of comparable condos and a higher share of investment-style buildings, which can temper pricing but support active trade.
Porter’s houses may offer private outdoor space and a quieter block, while Kendall can deliver newer finishes and direct access to major employers. Per-square-foot figures can diverge based on age, finish level and the rarity of house types near Kendall.
A Central property may price on rent roll and cap rate, appealing to investors. A similar building in North Cambridge could draw more owner-occupiers who value future owner use with supplemental income, which changes how buyers assess returns.
Keep an eye on hiring announcements, lab and residential deliveries, and transit service updates. Academic calendars and rate changes can alter demand quickly near Harvard, MIT and Kendall. Revisit comps on a rolling basis and adjust expectations if new listings shift the local mix.
Micro-markets are hyper local. The right pricing or offer strategy starts with clear definitions, tight comps and a plan that speaks to the target buyer. With decades of Cambridge and Somerville experience across single-family, condos and multi-family deals, our team pairs neighborhood expertise with full-funnel marketing to help you act with confidence.
Ready to compare your options or set the right list price? Connect with the local team that treats your goals like our own. Explore your next step with GV Realty Services.


Our job is to provide the most up-to-date local market stats, arrive at a price, and using cutting-edge as well as traditional marketing efforts, provide an exceptional customer service to every single client.
Get In Touch With Our Team To Learn More

GV Realty Services
1000 Massachusetts Ave Ste 134 Cambridge MA 02138